A Detailed In Design Product

See the Shift
Before the Drop.

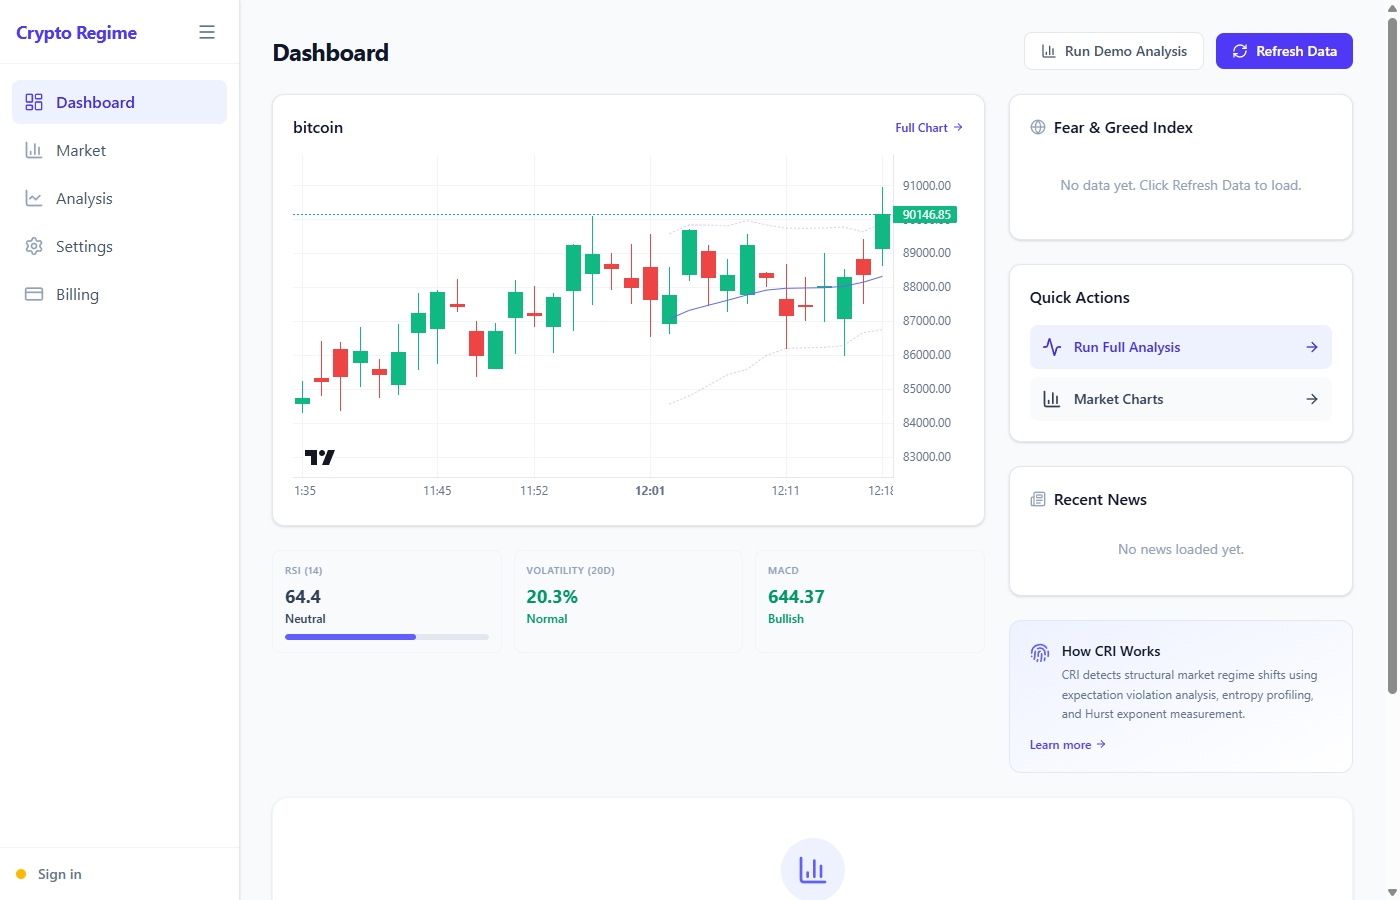
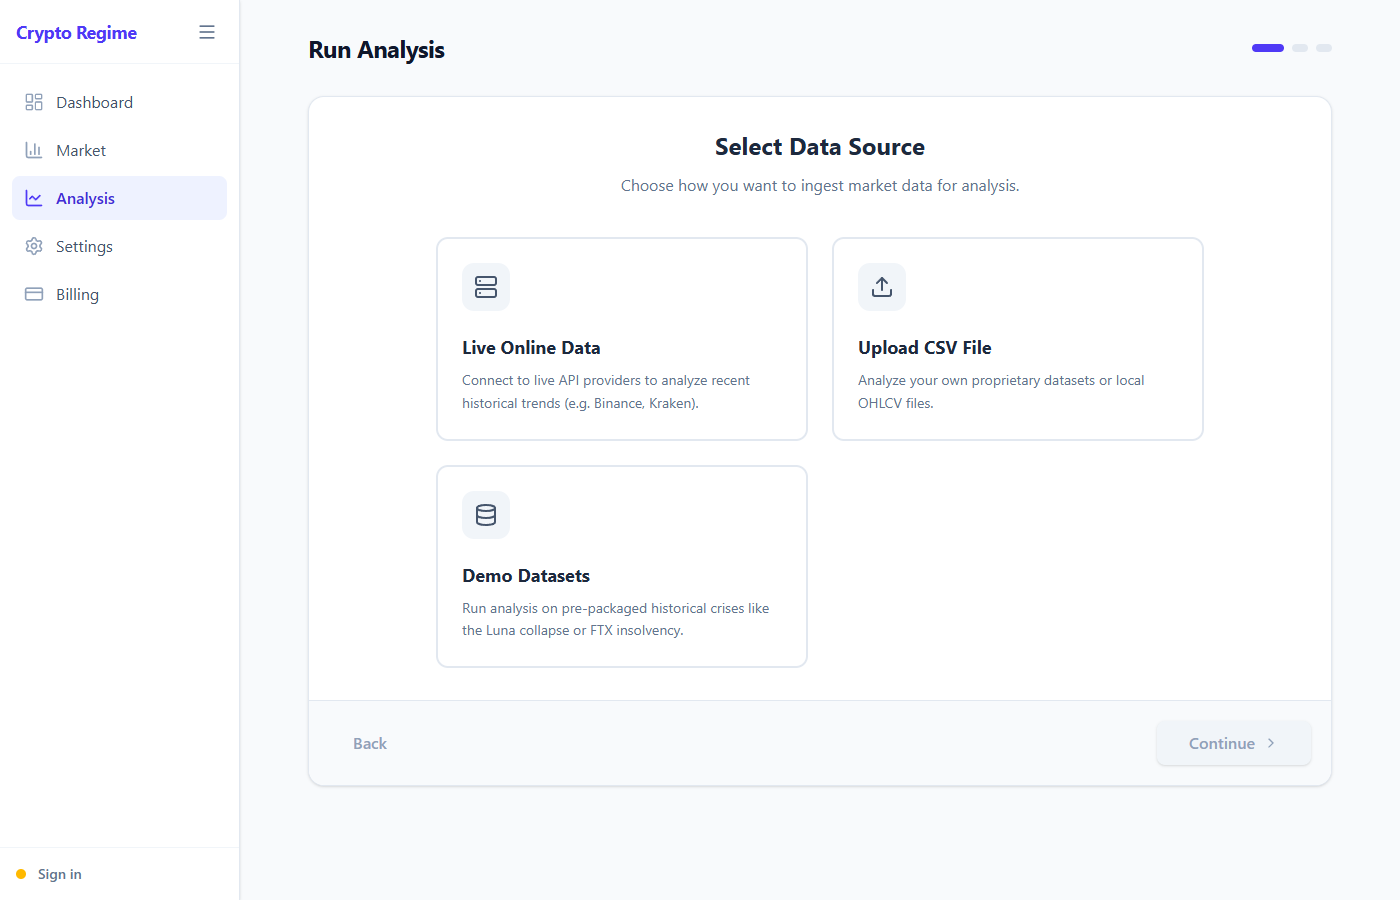
Your indicators told you what happened yesterday. Crypto Regime detects when the market's structural rules are changing — days before price, sentiment, or volume catch up.

No setup fees • Desktop + Web • Cancel anytime — access through billing period

Crypto Regime Intelligence
Crypto Regime Intelligence Dashboard showing real-time regime detection
0
Independent stress dimensions
0
Automated tests in codebase
0%
Server-side inference (IP protected)
$0/mo
Starting price, no setup fees

Sound Familiar?

These are the problems crypto traders live with every day. They don't have to.

"I Saw It Coming — In Hindsight"

Every crash looks obvious after the fact. Luna, FTX, the 2022 correlation cascade — the structural stress was building for days. But your RSI and MACD didn't tell you that.

CRI detects regime shifts while they're forming, not after they've resolved.

"Every Tool Shows Me the Same Thing"

Price charts, volume bars, sentiment scores — they're all downstream indicators. By the time Twitter sentiment turns bearish, the move is already underway. You're paying for a rearview mirror.

CRI reads the hidden statistical structure underneath price — where shifts originate.

"One Number Doesn't Tell Me Enough"

A single "fear" score or "risk" number hides more than it reveals. Is it volatility? Leverage? Correlation? You can't make different decisions if you can't see which dimension is driving the signal.

CRI tracks 6 independent stress dimensions. You see exactly where pressure is building.

Not Another Charting Tool.
An Early Warning System.

Most platforms show you what's happening. CRI shows you what's about to change. Institutional-grade statistical analysis made accessible — the layer your current setup is missing.

Six Stress Dimensions

Volatility, correlation, leverage, liquidity, dominance, and momentum — tracked independently. No single magic number. You see exactly where stress is concentrated and where it's spreading.

Regime Classification

Statistical classification models identify whether the market is in a normal, stressed, or crisis state. The persistence metric measures whether trends are sustainable or fragile — before momentum dies.

AI-Powered Verdicts

Our AI engine synthesizes raw statistical output into plain-English verdicts: RED, YELLOW, or GREEN. Every decision ranked, every violation narrated, every verdict timestamped and immutable.

Change Point Detection

Advanced sequential detection methods pinpoint the exact moment a distribution shifts. Not "volatility is high" — but "the behavior of volatility has fundamentally changed."

Contagion Mapping

Dependency analysis reveals asymmetric tail dependence: do BTC and ETH crash together, or just rally together? Crypto typically shows higher co-crash risk — CRI quantifies exactly how much.

From Raw Data to Regime Intelligence

Three steps. No PhD required. No setup fees.

1

Connect

Use CRI’s built-in managed market feed for recent public-source pricing, upload your own CSV datasets, or start with pre-built demo scenarios like the Luna collapse. Desktop app or web — your choice.

2

Analyze

The engine computes advanced volatility, multi-scale correlation, entropy concentration, trend persistence, and tail dependence metrics. Statistical models classify the current regime. All server-side.

3

Act

Get a color-coded verdict (RED/YELLOW/GREEN) with a plain-English narrative: which dimensions are stressed, which scenarios are active, and what changed. Timestamped and immutable.

The Math Behind the Edge

CRI doesn't read price charts. It reads the hidden mathematical structure underneath them.

LIVE STRESS MONITOR
Volatility
0.82
Correlation
0.67
Leverage
0.91
Liquidity
0.34
Dominance
0.55
Momentum
0.73
REGIME STRESSED
PERSISTENCE 0.38
VERDICT RED

How Crypto Regime Compares

You're evaluating options. We respect that. Here's what you're actually comparing.

Capability Charting Tools On-Chain Analytics Crypto Regime
Detects regime shifts No No Yes — Multi-model classification
Stress dimensions 1–2 indicators On-chain only 6 independent gauges
Trend sustainability Momentum (RSI) No Trend persistence analysis
Co-crash risk No Correlation only Tail dependence analysis
Change point detection No No Sequential detection
Explainable output Raw charts Data tables AI narrative verdicts
Typical cost $0–$30/mo $29–$799/mo From $39/mo

Comparisons based on published pricing and feature documentation from Glassnode, CryptoQuant, Nansen, and Santiment.

Crypto Regime Intelligence analysis platform

What Others Miss, You'll See First

Sentiment dashboards, on-chain trackers, and social scanners all share the same flaw — they're lagging indicators dressed up as predictions.

By the time exchange outflows spike, correlation breakdown already signaled contagion risk. By the time Twitter turns bearish, structural stress has been building for days. A persistence metric dropping from 0.6 to 0.35 is a powerful signal that the trend's foundation is crumbling. CRI catches it. RSI doesn't.

Your current tools show you what's happening. Crypto Regime shows you what's about to change.

Transparent Pricing. No Surprises.

Institutional-grade regime detection at a fraction of what hedge funds pay. No setup fees. Cancel anytime — access continues through your billing period.

Starter
$39 /month

Save $69/yr with annual billing at $399/yr

For individual traders ready to see beyond price charts.

  • Wallet monitoring
  • Basic compliance checks
  • Transaction tracking
  • Regime classification
  • Trend persistence analysis
  • Desktop + Web access
Enterprise
$199.20 /month

Save $391.20/yr with annual billing at $1,999.20/yr

For teams and funds that need dedicated infrastructure and compliance.

  • Everything in Professional
  • Dedicated inference cluster
  • Immutable audit trail export
  • Custom scenario profiles
  • API access
  • Multi-seat team accounts
  • Priority support
  • SOC-2 certification available

SOC-2 certification available at 20% premium. Professional and Enterprise include a 20% customer discount. All analysis runs server-side — algorithms never ship in the desktop binary.

Questions We Get Asked

Straight answers. No sales speak.

They complement each other. TradingView shows you price charts and technical indicators — lagging signals that tell you what already happened. Glassnode tracks on-chain flows — useful, but still reactive. CRI sits underneath both: it detects when the market's statistical structure has changed, which typically precedes the signals those tools eventually show you. Think of it as the early warning layer your existing stack is missing.

Markets operate in different "regimes" — statistical states where the rules of behavior are fundamentally different. A trending regime behaves differently than a mean-reverting one. A low-correlation regime diversifies well; a high-correlation regime means everything crashes together. CRI uses statistical classification models to identify which regime the market is currently in, and detect when it's transitioning to a new one.

No, and that's by design. Price prediction is a fool's errand. CRI detects structural changes — when the market's behavior is shifting in ways that typically precede major moves. It's a weather system, not a crystal ball. It tells you the pressure is building; you decide what to do about it. This makes it far more reliable than any price forecast.

Yes. The raw math runs server-side, but what you see is a color-coded verdict — RED, YELLOW, or GREEN — with a plain-English narrative explaining exactly which stress dimensions are elevated, what scenarios are active, and what changed. You don't need to understand the math behind trend sustainability to act on "trend sustainability is collapsing."

One avoided bad trade easily covers a year of CRI. The Starter plan gives you regime classification and trend persistence analysis that hedge funds pay six figures for. The Professional plan at $79.20/month adds the full six-dimension stress analysis and AI verdicts. For context, Glassnode's comparable tier is $799/month. CRI gives you capabilities they don't offer at all — at a tenth of the price.

Two reasons. First, intellectual property protection — our algorithms don't ship in any binary you can decompile. Second, consistency — you always get the latest model updates without downloading anything. The desktop and web apps are thin clients that display results; all heavy computation runs on our secured infrastructure.

The next regime shift won't wait
for you to be ready.

Stop reviewing yesterday's signals. Start detecting tomorrow's structural changes. Desktop and web — one platform, one edge.